An investigation into Toronto SERVICE REQUESTS
What annoys your part of Toronto?
Toronto receives thousands of 311 service requests, a running record of what residents notice, question, and need from the city. This story begins with a simple question: do different parts of Toronto complain about different things?
THE DATA
~290k
311 service requests
January — June 2026
6 months of reports
25
Toronto wards
I first compared how frequently each type of complaint occurred across the city. I then looked at each ward separately to identify complaints that were unusually prominent relative to the city as a whole.
This second measure is what I call a “signature complaint.”
How I explored the data
How is a signature complaint calculated?
A complaint becomes “signature” when it appears much more often in one area than it does across Toronto overall.
A simple example · vehicle noise
10%
of this ward’s requests are about vehicle noise
2%
of all Toronto requests are about vehicle noise
=
5×
more prevalent in this ward
A score of 5× means vehicle-noise requests are five times more prevalent in this ward than they are across Toronto.
The general calculation
Area Share
How common is this request in this ward?
City Share
How common is it across Toronto?
Distinctiveness Score
Area Share ÷ City Share
One final filter
Only categories with at least 50 requests are eligible. The highest eligible distinctiveness score becomes that area’s signature complaint.
Each ward has a signature complaint.
Every area has its own pattern of requests. This map lets you explore the categories that appear more often in each part of Toronto than they do across the city as a whole. Hover over a ward to see its signature complaint.
Map 01. Darker wards have complaints that are more distinctive to that area.
How to read distinctiveness scores:
1× = same prominence as Toronto overall
>1× = more prominent than Toronto overall
<1× = less prominent than Toronto overall
Finding #1
Motor vehicle noise was 17.7×
more prominent in Ward 6 than
across Toronto.
So I looked closer at 904 requests about motor vehicle noise in Ward 6.
THE QUESTION
Where were all those complaints actually coming from?
I looked closer at the 904 motor vehicle noise requests in Ward 6.
836 / 904
92.5%
of Ward 6's motor vehicle noise reports came from a single intersection: Bathurst St × Canyon Ave.
But was this just a one-off?
I checked when those 836 requests were submitted.
They weren't concentrated in a single month. The reports appeared throughout the January–June period.
Highly concentrated in one location.
Persistent over time.
This suggests Ward 6's unusual motor vehicle noise pattern isn't simply the result of one short-lived spike. The complaints kept coming from the same intersection over several months.
Finding #2
Graffiti isn't just a ward-level story.
While exploring the signature complaints, I noticed something interesting: graffiti appeared as the signature complaint across several neighbouring wards in inner Toronto.
THE QUESTION
Was this a coincidence, or a broader geographic pattern?
I compared graffiti's distinctiveness across wards to see whether the pattern was isolated to one ward or appeared across neighbouring areas.
Graffiti appears clustered in inner Toronto.
Several neighbouring wards show elevated graffiti distinctiveness, rather than one isolated hotspot.
Ward 11 stands out most strongly: graffiti is 4.46× as prominent there as it is citywide.
This suggests that some 311 complaints aren't just distinctive to individual wards, they can reveal broader geographic patterns across neighbouring parts of Toronto.
Map 02. Darker wards have higher graffiti distinctiveness scores.
How to read graffiti distinctiveness scores:
1× = same prominence as Toronto overall
>1× = more prominent than Toronto overall
<1× = less prominent than Toronto overall
But there’s another way to look at the data
What stands out isn’t always what happens most.
So far, we’ve been looking for 'signature complaints', requests that are unusually concentrated in a particular ward compared with Toronto as a whole.
But we can ask a simpler question: What’s the most common complaint in each ward?
Top complaint
What happens most?
The complaint with the highest number of 311 requests in a ward.
Signature complaint
What stands out?
The complaint that is disproportionately represented in a ward compared with Toronto overall.
A complaint can be the most frequently reported in a ward without being particularly unusual there. A signature complaint measures how strongly that complaint stands out relative to the citywide pattern.
So what happens when we simply ask: what’s reported most?
Finding #3
Potholes aren't just a local priority,
they're Toronto's #1 complaint.
Across the city, Road Pothole / Road Damage generated more 311 requests than any other complaint type, with 21,505 requests in total.
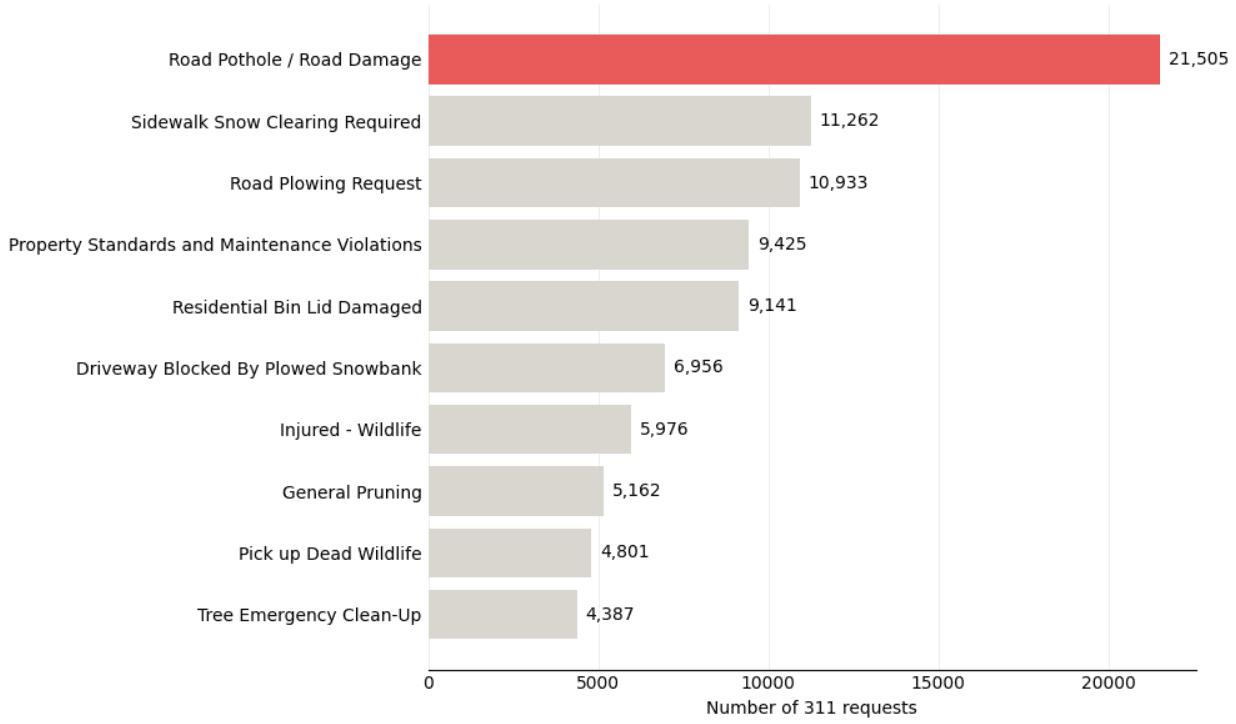
The 10 most frequently reported 311 complaint types in Toronto, ranked by request count
THE QUESTION
But was this just because of a few wards with unusually high numbers?
When I looked at each ward separately, Road Pothole / Road Damage still ranked #1 in 18 of Toronto's 25 wards.
That means potholes aren't just the most common complaint citywide, they're the top complaint across most of Toronto's wards.
Map 03. Wards in Toronto that have Pothole/ Road Damage as their #1 Complaint
Red = Potholes are the #1 complaint
Light Red = Another complaint is #1
What do these patterns reveal about Toronto?
Toronto doesn't complain about just one thing.
Some problems are everywhere.
Others are distinctly local.
311 gives us a running record of what residents report and looking at that record by place reveals patterns hiding behind the citywide totals.
So next time you submit a 311 request, remember: you might just be adding to Toronto's signature.